Data Transformation & Visualization - SQL
Covid19 Vaccination & Infection Analysis

Aspiring Data Analyst skilled in SQL, Tableau, PowerBI, Python, R Programming & Excel

SQL Skills used-
~ Data Type Casting
~ Joins
~ Extraction of Data using PARSENAME

This Portfolio Project is Capstone Project for Google Data Analytics Professional Certificate. This project answers the business "How do annual members and casual riders use Cyclistic bikes differently?" and provides a complete analysis of how to capitalize that difference to increase the number of members

This Project is a visual representation of the havoc that Covid19 Virus created all around the World & underlying SQL queries that include various calculations performed on raw data
SQL Skills used-
~ TEMP Tables
~ Joins
~ Data Transformations
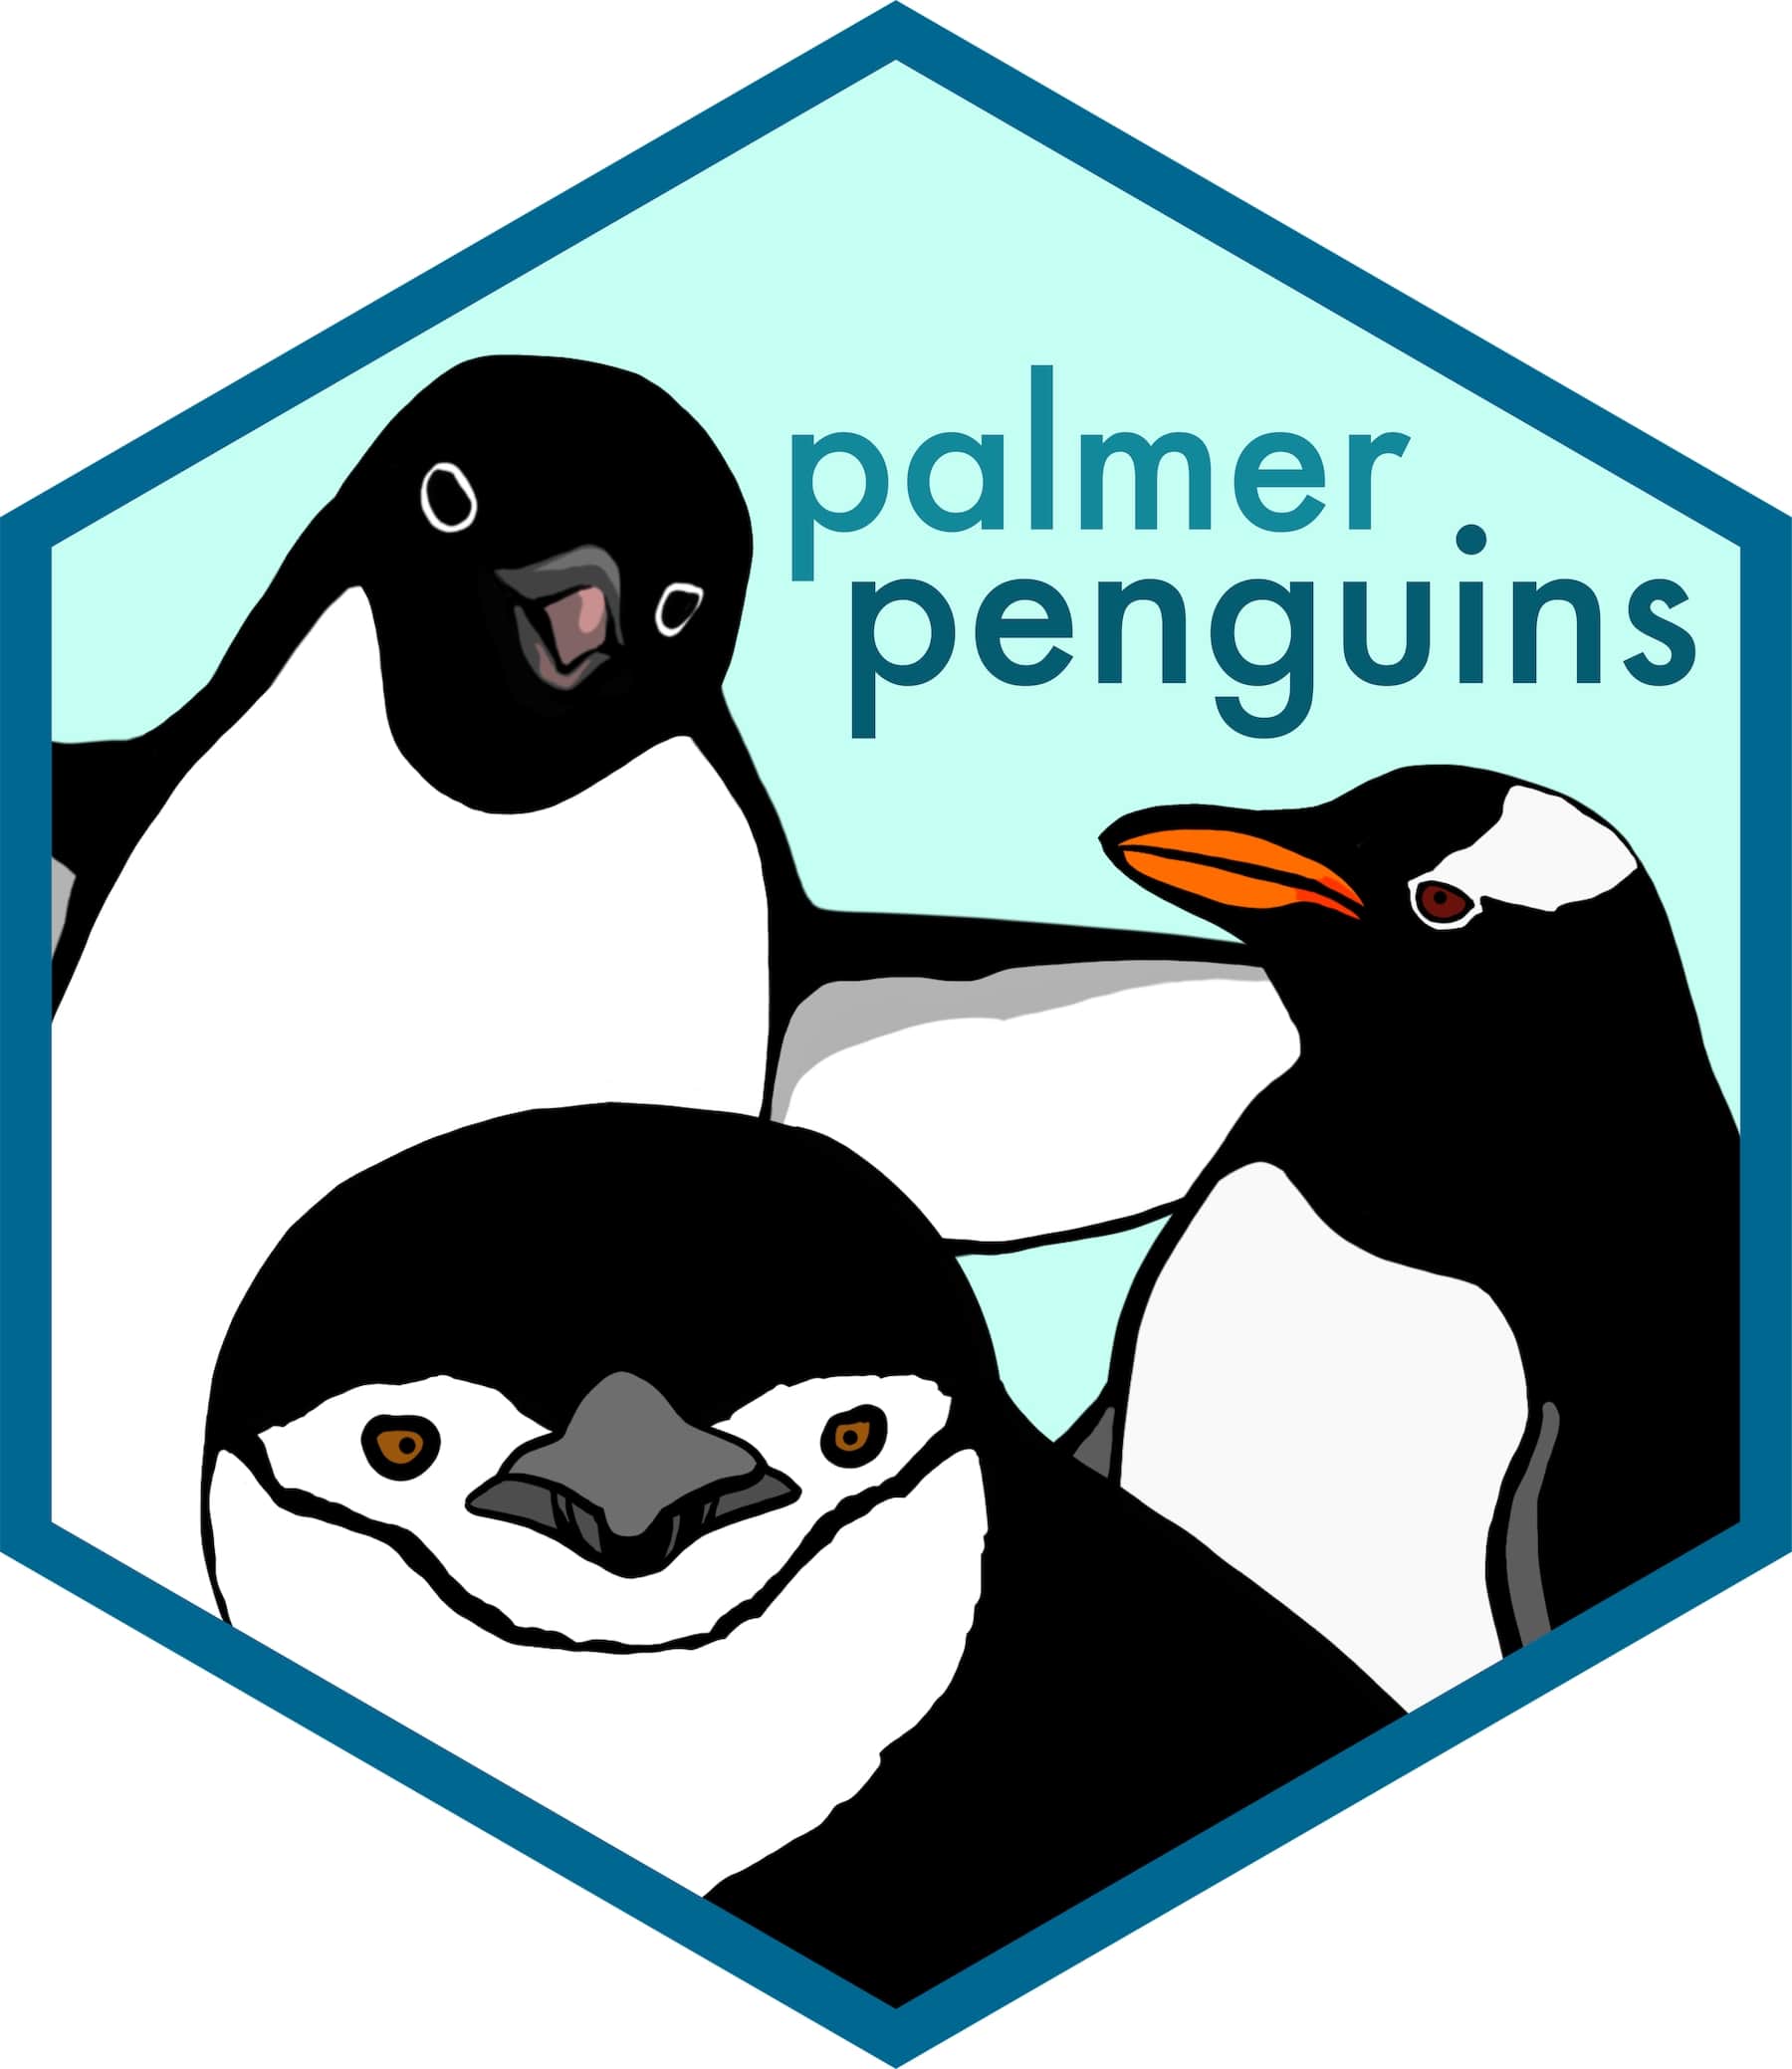
Using R Programming Language and R studio, I have created this project to find the Count of total Penguins & three species as well as to analyze the Mean Bill Length of Penguins and how it varies from island to island

SQL Skills used-
~ Joins
~ CASE Statement
~ Data Transformations